p5.js Online Help Reference
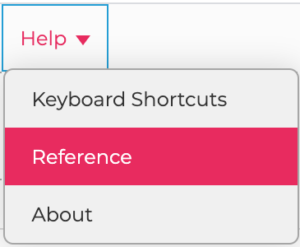 We’ve seen a lot of different drawing functions so far and it can be hard to remember them all and how they work. Fortunately, help is close at hand! The p5.js online editor has an excellent reference built-in that covers all p5.js functions. You can access it through the Help menu, and choose Reference. Check it out! So far, all of the functions we’ve covered are there, including bits of sample code.
Let’s expand our toolbox of drawing functions by looking at a few more useful ones.
More Polygons
 You’ll recall from math class that a polygon is a multi-sided shape. So far we have used the rect() function to draw a 4-sided polygon. But there are many other polygons we might want to draw; for example, triangles, parallelograms, and octagons.
Here is a summary of some useful polygon drawing functions, click on each function name below to view the online reference material for each.
| Function | Description |
| triangle(x1, y1, x2, y2, x3, y3) | Draws a triangle by connecting three points. |
| quad(x1, y1, x2, y2, x3, y3, x4, y4) | Draws a quadrilateral (polygon) by connecting four points (in order). |
|
|
These functions work together to create a shape with any number of sides. The beginShape() function tells p5.js that you are about to specify a series of (x,y) points (called vertices) to be joined. The vertex() function is used to specify each point for your shape, p5.js will use these points to “connect the dots” for your polygon. The endShape() function tells p5.js that you are finished specifying vertices. If you want to join the first and last vertex points (to close the shape) you can include the optional CLOSE argument to this function. |
Here’s an example of these functions in action:
|
1 2 3 4 5 6 7 8 9 10 11 12 13 14 15 16 17 18 19 20 21 22 23 24 25 26 27 28 29 30 |
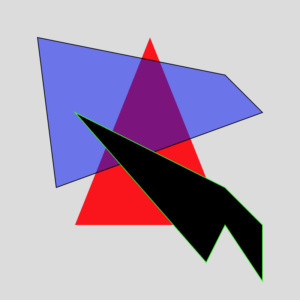
function setup() { createCanvas(400, 400) } function draw() { background(220) // Solid red triangle, no outline noStroke() fill(255, 0, 0) triangle(200, 50, 100, 300, 300, 300) // Blue quadrilateral, 50% transparent, black line stroke(0) fill(0, 0, 255, 128) quad(50, 50, 300, 100, 350, 150, 75, 250) // 6-sided black shape, green line stroke(0,255,0) fill(0) beginShape() vertex(100, 150) vertex(300, 250) vertex(350, 300) vertex(350, 375) vertex(300, 300) vertex(275, 350) // Connect start and end vertex endShape(CLOSE) } |
Arcs and Curves
 p5.js also includes some very powerful functions for drawing arcs (think Pac-Man) and different types of curves.
 To draw an arc, you need to specify the start and end angles. You are probably used to thinking in degrees for angle measurements. p5.js uses a different system called radians (based on fractions of π). Fortunately, there is a function called radians() that will convert degree measurements into radians for us so we don’t need to get into the details of radians — I’ll leave that to your future math teacher.
| Description | |
| arc(x, y, w, h, startAngle, stopAngle, [drawMode])
|
Draws a section of an ellipse. The first four arguments are the same as an ellipse, the next two specify the angles which the arc should start and finish (in radians). There is an optional 7th drawMode argument that can be OPEN, CHORD, or PIE depending on the style of arc you’d like.
You are probably used to using degrees to represent angles, but p5.js uses radians. Fortunately, there is a function called radians() that will convert from degrees into radians for you. I’ve used this in the example code below. |
| curve(x1Anchor, y1Anchor, x2, y2, x3, y3, x4Anchor, y4Anchor)
|
Draws a curve called a Catmull-Rom Spline. The first and last pair of coordinates define the start and end anchor points for the curve, and the middle two pairs of coordinates (x2, y2) and (x3, y3) define the part of the curve to draw on the canvas. |
| bezier(x1Anchor, y1Anchor, x2, y2, x3, y3, x4Anchor, y4Anchor)
|
Draws another type of curve called a Bezier curve. The first and last pair of coordinates define the start and end of the curve, but the middle two pairs of coordinates (x2, y2) and (x3, y3) define the shape of the curve by “pulling” the curve toward them. |
Here’s some example code to demonstrate these drawing functions:
|
1 2 3 4 5 6 7 8 9 10 11 12 13 14 15 16 17 18 19 20 21 22 |
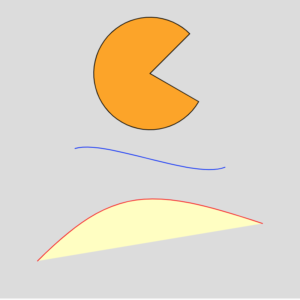
function setup() { createCanvas(400, 400) } function draw() { background(220) // Orange arc, black line stroke(0) fill(255, 165, 0) arc(200, 100, 150, 150, radians(30), radians(315), PIE) // Blue Catmull-Rom Curve (blue line only) noFill() stroke(0, 0, 255) curve(50, 300, 100, 200, 300, 225, 350, 100) // Pale yellow Bezier curve, red line stroke(255,0,0) fill(255,255,191) bezier(50, 350, 150, 250, 200, 250, 350, 300) } |
You Try!
- Use the arc() function to draw four yellow PacMan figures. Have each facing in a different direction (left, down, right, and up). Don’t forget to draw an eye for each figure!
- Use the arc() function to create a pie chart that is divided into 4 different coloured slices: 40%, 30%, 20%, and 10% of the pie.
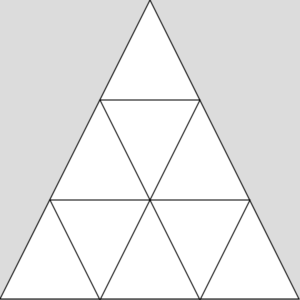
- Here’s another brain teaser. Draw the following figure using only 4 calls to the triangle() function.
- Wassily Kandinsky was a famous Russian painter and is considered by many to be a pioneer of abstract art. In the 1920’s he was very interested in creating abstract art using simple geometric shapes — he would have loved p5.js! Below is one of his priceless paintings (“Composition II”) that I’ve ripped off the Internet (for free!).
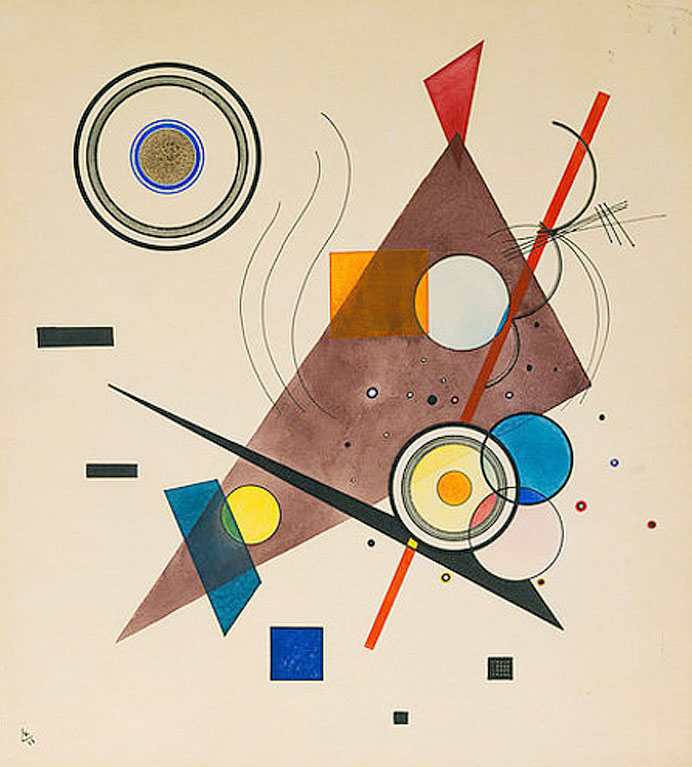 Try to reproduce his painting using as many of the p5.js functions you have learned so far! If you look carefully at his work you will see the subtle use of transparency. Paint colours and RGB colours mix differently so your transparency colours may look different (that’s ok!).